Neutral Density (ND) Filter Chart
I was always attracted by the photos with long exposure times. It moves me this tool. The extraordinary plasticity which it owns, I find a powerful means by which to get their message to the observer, their emotions and express both drama and anguish as well as surreal tranquillity and peace.
When I resume with long exposure times using ND filters more driven ie those with the highest factor ND. In particular those used by the Lee Filters, Little stopper 6 Stop and Big stopper 10 stops.
By using this type of filter it is necessary to calculate with any precision the shutter speed and frankly I do not like to depend on tools that can deplete the battery as calculators or phones, because with long shutter speeds you already have work cut out to manage camera batteries. So I decided to create my table once I then molded plastic to protect it from the elements.
Given the small size, this table has always a place in my photographic backpacks. So I hope that it will also be helpful to you.

Link to download the chart in PDF format: ND Filter Exposure Chart
Instructions for the use of the chart:
In the first of the left column, in ascending chronological order, from top to bottom, there are the times of exposure.
In the columns that are to the right of the first, we increased the exposure times for the STOP factor** relative to the ND filter that you want to use.
*** In photography, stops are unit used to quantify ratios of light or exposure, with each added stop meaning a factor of two, and each subtracted stop meaning a factor of one-half.
To locate faster the shutter speed I used different colors for the background of the cells and different font sizes. In this manner, the columns for the use of ND filters that I use most often:
Highlighted in blue are the shutter speed times columns of "softer filters" such as ND 0.3, ND 0.6 and the ND 0.9;
Highlighted in yellow is the LITTLE stopper times column, ND 6;
Highlighted in red is the BIG stopper times column, ND 10.
The last column, the green one, is for the most extreme case, namely that the combined use of more LITTLE BIG stopper that together give an ND factor 16.
In the table I then highlighted 3 areas of cells with different colors; green, red and yellow. Each area is related to the use of a given filter; yellow for the LITTLE stopper, red for the the BIG stopper and green for the use of the LS together with the BS.
Having highlighted these areas is a visual aid to go quickly to the exposure values that use with more frequency with all filters, normally from one minute to a maximum of three. Rarely Rates of recovery use over the three minutes because the amount of hot pixels begins to be excessive and consequently then increases the time required to eliminate them in postproduction.
One important caveat; the Lee Filters alerts customers that the actual stocking rate of each LS and BS may vary + or -. I can confirm thats what's going on and then I advise you to run tests with your filters to see as these deviate from the values in the table.
Some practical advise for outdoor use, is to print the table (no glossy paper), crop it and then laminate it. That way you can always keep it in your backpack which can still be practical in the rain, near waterfalls or resting it in winter on snow.
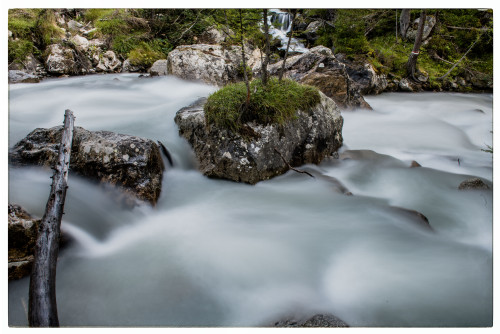
Nikon D810, 24-70 mm, BIG stopper ND filter, 8,0 sec, f/22.
On a beautiful day, I want to take a picture of a waterfall using the long exposure technique. The result will be that the water will take on a silky appearance. This effect is called motion blur and is the result of the greater amount of light reflected by the water reaching the sensor thanks to the long shutter speed.
First, we position and set up the equipment (a good tripod and a remote shutter release are essential), compose the shot and finally adjust the camera, without any filters, for the correct exposure at the aperture we want. In our example, this corresponds to 1/125 of a second; we note this value down.
Now we attach the ND filters we have chosen for our shot; the higher the ND factor we apply, the longer the exposure will be. In our example, we are using the BIG stopper filter. Its ND value is 3.0, which corresponds to 10 stops;
I now take my ND filter chart and go to the column with the ND density 3.0 and start scrolling down the cells until I come across the row with an exposure time of 1/125, the value we noted earlier. The cell at the intersection shows an exposure time of 8 seconds, which is the shutter speed I will need to use to obtain a correctly exposed photo using the BIG stopper ND filter. Done!